Change during operation: N = impossible, Y* = possible (enabled by using ),
Y
= possible (enabled by using
)
-
45
-
FUNC
DATA
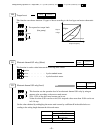
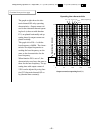
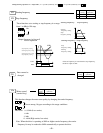
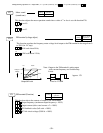
The graph at right shows the elec-
tronic thermal O/L relay operating
characteristics. Output current val-
ues for the electronic thermal operat-
ing levels (values set with function
F11) are plotted horizontally and op-
erating times for output current are
plotted vertically.
This graph is for F10 = 1 with the
base frequency of 60Hz. The charac-
teristics for output frequencies ex-
ceeding the base frequency are the
same as the characteristics for the
base frequency.
When function F10 is set to 2, the
characteristics are always the same as
those for the base frequency. The op-
erating time with output current of
150% can be adjusted by using func-
tion F12 (electronic thermal O/L re-
lay (thermal time constant)).
“ ® ? ì? ? Œ À “ Á
0
5
1 0
1 5
2 0
0 5 0 1 0 0 1 5 0 2 0 0
?
o
—
Í
“
d
—
¬
?
^
“
®
?
ì
ƒ
Œ
ƒ
x
ƒ
‹
?
Y
’
è
’
l
?
“®?ì??SÔ?@?m•ª?n
6
0
H
z
(
=
Í
?
°
?
?
ü
”
g
?
”
50H
z
30H
z
20H
z
5Hz
1Hz
Continued from previous page
Set with
F12
Output current/set operating level (%)
Operating time (minute)
Operating time characteristics
(Base frequency)


