Appendix C: Chromaticity Reference
Appendices
C-8
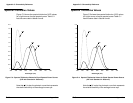
Spectral Tristimulus Values
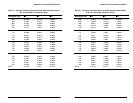
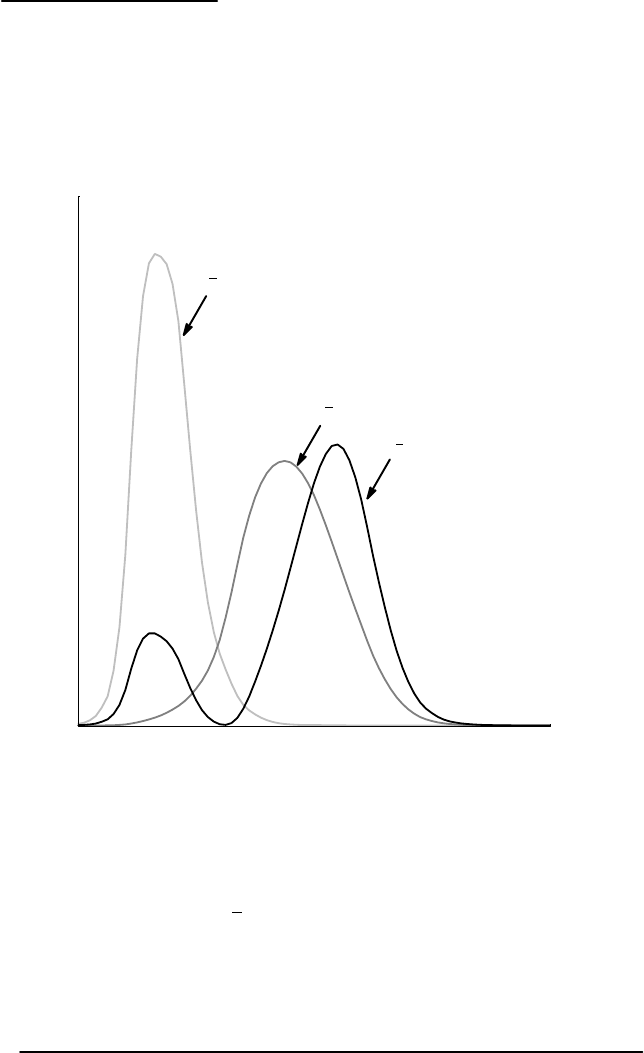
FigureĂCĆ5 shows the spectral tristimulus (XYZ) values
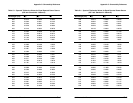
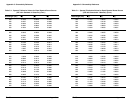
for a light source of equal spectral power. Table CĆ1
lists the same data in tabular format.
0
0.2
0.4
0.6
0.8
1.0
1.2
1.4
1.6
1.8
2.0
380 430 480 530 580 630 680 730 780
x(l)
y
(l)
z
(l)
Wavelength (nm)
Figure CĆ5:ăSpectral Tristimulus Values for Equal Spectral Power Source
(CIE 1931 Standard 2° Observer)
Note that y(l) is also the photopic curve that represents
the relative sensitivity of the average human eye.


