


Performance Chart - 2150
311879F 49
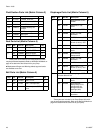
Performance Chart - 2150
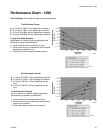
Test Conditions: Pump tested in water with inlet submerged
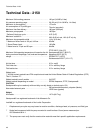
Fluid Pressure Curves
A
at 120 psi (0.7 MPa, 7 bar) operating air pressure
B at 100 psi (0.7 MPa, 7 bar) operating air pressure
C at 70 psi (0.48 MPa, 4.8 bar) operating air pressure
D at 40 psi (0.28 MPa, 2.8 bar) operating air pressure
T
o find Fluid Outlet Pressure
(psi/MPa/bar) at a specific fluid flow (gpm/lpm) and
o
perating air pressure (psi/MPa/bar):
1. Locate fluid flow rate along bottom of chart.
2
. Follow vertical line up to intersection with selected
operating air pressure curve.
3
. Follow left to scale to read fluid outlet pressure.
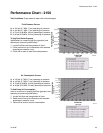
Air Consumption Curves
A at 120 psi (0.7 MPa, 7 bar) operating air pressure
B at 100 psi (0.7 MPa, 7 bar) operating air pressure
C at 70 psi (0.48 MPa, 4.8 bar) operating air pressure
D at 40 psi (0.28 MPa, 2.8 bar) operating air pressure
To find Pump Air Consumption
(scfm or m
3
/min) at a specific fluid flow (gpm/lpm) and
operating air pressure (psi/MPa/bar):
1. Locate fluid flow rate along bottom of chart.
2. Read vertical line up to intersection with selected
operating air pressure curve.
3. Follow left to scale to read air consumption.
Fluid Outlet Pressure
psi (MPa, bar)
20
40
60
80
100
120
0
(0.84, 8.4)
(0.7, 7)
(0.55, 5.5)
(0.41, 4.1)
(0.28, 2.8)
(0.14, 1.4)
20
40
60
80
100
120
0
(0.84, 8.4)
(0.7, 7)
(0.55, 5.5)
(0.41, 4.1)
(0.28, 2.8)
(0.14, 1.4)
140
(0.96, 9.6)
160
(1.10, 11.0)
180
(1.24, 12.4)
Air Consumption
Fluid Flow
gpm (lpm)
scfm (m
3
/min)
Fluid Flow
gpm (lpm)
20
(75)
40
(151)
60
(227)
80
(302)
100
(378)
120
(454)
140
(530)
160
(605)
20
(75)
40
(151)
60
(227)
80
(302)
100
(378)
120
(454)
140
(530)
160
(605)
180
(681)
TI8740A
TI8742A
TI8742A
TI8741A