


Performance Chart - 1040
311879F 33
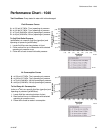
Performance Chart - 1040
Test Conditions: Pump tested in water with inlet submerged
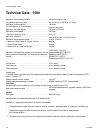
Fluid Pressure Curves
A
at 120 psi (0.7 MPa, 7 bar) operating air pressure
B
at 100 psi (0.7 MPa, 7 bar) operating air pressure
C
at 70 psi (0.48 MPa, 4.8 bar) operating air pressure
D
at 40 psi (0.28 MPa, 2.8 bar) operating air pressure
T
o find Fluid Outlet Pressure
(
psi/MPa/bar) at a specific fluid flow (gpm/lpm) and
o
perating air pressure (psi/MPa/bar):
1. Locate fluid flow rate along bottom of chart.
2
. Follow vertical line up to intersection with selected
operating air pressure curve.
3
. Follow left to scale to read fluid outlet pressure.
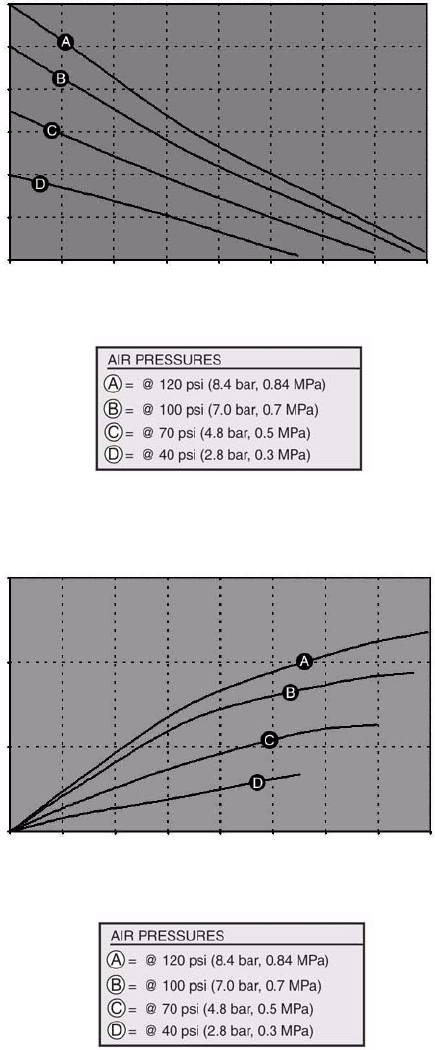
Air Consumption Curves
A at 120 psi (0.7 MPa, 7 bar) operating air pressure
B at 100 psi (0.7 MPa, 7 bar) operating air pressure
C at 70 psi (0.48 MPa, 4.8 bar) operating air pressure
D at 40 psi (0.28 MPa, 2.8 bar) operating air pressure
To find Pump Air Consumption
(scfm or m
3
/min) at a specific fluid flow (gpm/lpm) and
operating air pressure (psi/MPa/bar):
1. Locate fluid flow rate along bottom of chart.
2. Read vertical line up to intersection with selected
operating air pressure curve.
3. Follow left to scale to read air consumption.
5
10
15
20
25 30
35
40
20
40
60
80
100
120
Fluid Outlet Pressure
Fluid Flow
0
(0.84, 8.4)
(0.7, 7)
(0.55, 5.5)
(0.41, 4.1)
(0.28, 2.8)
(0.14, 1.4)
(19)
(38)
(57)
(76)
(95) (114)
(133)
(152)
20
40
60
0
(0.41, 4.1)
(0.28, 2.8)
(0.14, 1.4)
5
10
15
20
25 30
35
40
(19)
(38)
(57)
(76)
(95) (114)
(133)
(152
)
Air Consumption
psi (MPa, bar)
gpm (lpm)
Fluid Flow
gpm (lpm)
scfm (m
3
/min)
TI8736A
TI8742A
TI8737
A
TI8742A