


9
BlueChart g2 User’s Guide
vIewIng bluechart g2 > understandIng the dIfferences between charts
Understanding the Differences Between Electronic
and Paper Charts
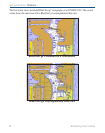
Occasionally, boaters notice that the BlueChart g2 data does not duplicate a particular feature
shown on the paper chart they are using. Garmin uses the best charts available and carefully
turns the paper charts into a digital format for display on an electronic screen. If there are
errors, omissions, or discrepancies on paper, they might occur electronically too.
On paper charts, sometimes even large features like a breakwater might not be shown clearly
or at all. Large breakwaters are sometimes not shown on the harbor charts, but are shown on
coastal charts—or vice versa. These decisions are made by the chart maker, such as NOAA/
NOS. In some cases, bridges, or other features washed away in storms decades ago, are still
shown on the paper charts. Recent changes in coastlines are often not reected on paper charts
for years.
The same is true for new marinas and ports. Sometimes, well-known local landmarks might be
shown so small on the paper chart that they are indistinguishable from surrounding features to
someone not familiar with the area. In these cases, a feature might not be accurately depicted
on the electronic chart.
Reporting Chart Errors
Even when a feature is shown on the paper chart, it can be overlooked or misspelled during the
data entry process. These are small problems that can be easily corrected and do not affect the
quality of the overall BlueChart g2 data.
If you notice something missing or incorrect in the BlueChart g2 data, rst check the best
available scale paper charts of the area to see how the feature is represented on the paper
chart. If we have not represented it accurately, or if you know additional information about the
feature, visit Garmin’s Web site and ll out the online error report form. You can nd this form
at www.garmin.com/cartography/.