


Appendix D: Detection Management Software DMS
Reporting and Printing
31
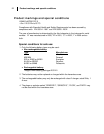
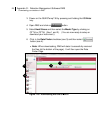
Reporting and Printing
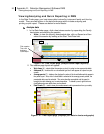
If you are in the Data finder page, you have the option to select button
and this will give you a report instantaneously using a standard template of graphs
and charts (also called panels.).
•
Viewing reports: if you are in the data layout page and you have rearranged the charts/tables, the
report will print in the sequence in which they appear on the screen.
• Printing reports: while in the report view page you have two options outlined below:
• Click on the icon from the title bar.
• Click on the icon from the session report title bar.
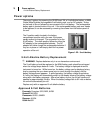
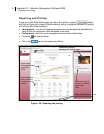
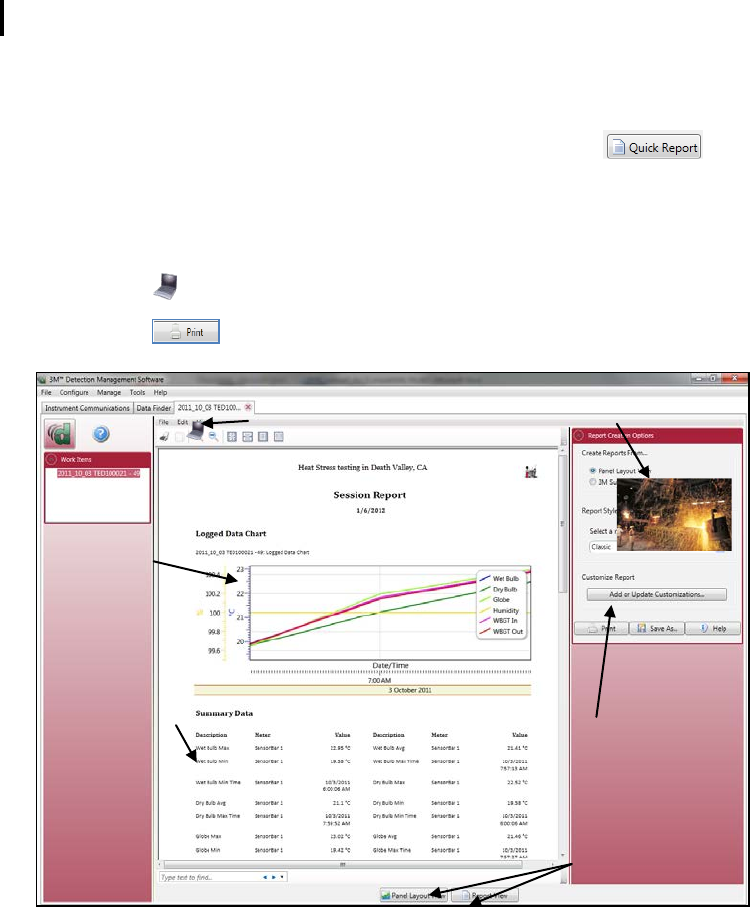
Figure 1-28: Reporting and printing
Report example
with logged data
chart from the
QT⁰36
Quickly switch back to the panel
layout view (charts & tables)
Reports are displayed in
the order in which they
are displayed from the
panel layout.
Customize the report by
inserting on-site testing images
Customize the report by
inserting on-site testing
images via the
button.
Print