


TRG-TRC016-EN 63
period three
System Variations
notes
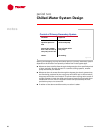
ARI. They are not, however, suggestions for good design practice for any given
system—they simply define a common rating point to aid comparisons.
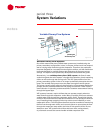
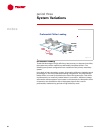
Trends toward improved humidity control and system-level energy efficiency
have led many design engineers to reduce the flow rates on both the chilled-
and condenser-water sides of the system. This results in smaller motors in the
pumps and cooling-tower fans, as well as smaller pipes and control valves in
the distribution system. The right column of this table shows one possible set
of conditions for a low-flow system. For comparison, 1.5 gpm/ton [0.027 L/s/
kW] through the evaporator results in a 16°F [8.9°C] ∆T, and 2.0 gpm/ton
[0.036 L/s/kW] through the condenser results in a 15°F [8.3°C] ∆T.
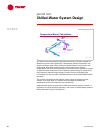
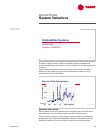
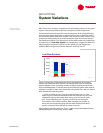
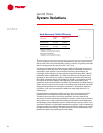
Figure 71 shows the combined annual energy consumption of the chiller,
chilled- and condenser-water pumps, and cooling-tower fans for these two
system designs. In fact, a growing number of design engineers and utilities
have published papers or manuals that recommend that system flow rates be
reduced. A number of them have found that using lower flow rates can reduce
both installed and operating costs.
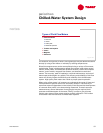
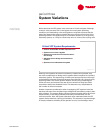
“…there are times you can ‘have your cake and eat it too.’ In most
cases, larger ∆T’s and the associated lower flow rates will not only save
installation cost but will usually save energy over the course of the
year. This is especially true if a portion of the first-cost savings is
reinvested in more efficient chillers. With the same cost chillers, at
worst, the annual operating cost with the lower flows will be about
equal to ‘standard’ flows but still at a lower first cost.”
(Source: Kelly, David W. and Chan, Tumin, “Optimizing Chilled Water Plants,”
Heating/Piping/Air Conditioning, January 1999)
Low-Flow Systems
annual energy consumption, kWh
annual energy consumption, kWh
base casebase case
base case
chiller
chiller
cooling tower fans
cooling tower fans
low flowlow flow
low flow
750,000
750,000
600,000
600,000
450,000
450,000
300,000
300,000
150,000
150,000
pumps
pumps
0
0
Figure 71