


TRG-TRC001-EN 55
period seven
Review
notes
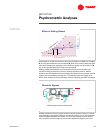
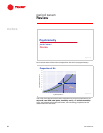
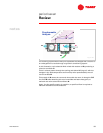
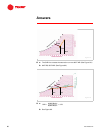
The resulting psychrometric chart plot represents the changes that a volume of
air undergoes as it travels through a typical air conditioning system.
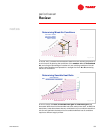
In this illustration, recirculated air A is mixed with outdoor air B, producing a
mixed air condition C.
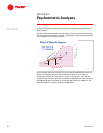
This air mixture passes through the cooling and dehumidifying coil, with the
changes in dry-bulb temperature and humidity ratio represented by the coil
curve from C to D.
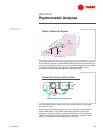
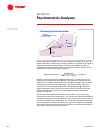
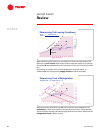
This supply air D enters the room and mixes with the room air along the SHR
line from D to A, absorbing the room’s sensible and latent heat gains, to
maintain the room at desired conditions A.
Again, for this specific supply air condition, a specific airflow is required to
maintain the desired room conditions.
&
&
2$
5$
%
%
$
$
'
'
6$
3V\FKURPHWULF
$QDO\VLV
6
+
5
O
L
Q
H
6
+
5
O
L
Q
H
$
$
%
%
&
&
'
'
Figure 88