


TRG-TRC001-EN 13
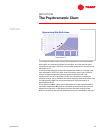
period one
The Psychrometric Chart
notes
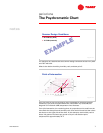
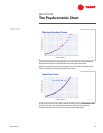
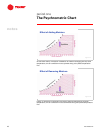
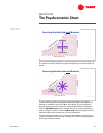
To complete this basic chart, the wet-bulb temperature lines must be added.
Once again, at a saturated condition the wet-bulb, dry-bulb and dew-point
temperatures are equal. Therefore, the wet-bulb temperature lines start at the
saturation curve.
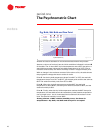
To observe what happens to wet-bulb temperatures when air is heated, start
with saturated air at 50°F dry bulb. At this condition, the air has a moisture
content of approximately 54 grains per pound as shown by A. If the
temperature of this air is increased to 75°F dry bulb without changing its
moisture content, the air condition will move along the constant humidity ratio
line (54 grains/lb) to B. The wet-bulb temperature of this warmed air is
approximately 60.1°F.
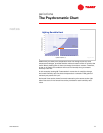
A line drawn from B to a point on the saturation curve that represents 60.1°F
saturation temperature (B’) gives an indication of the direction the wet-bulb
temperature lines will run. By taking numerous wet-bulb readings under
different conditions, the wet-bulb temperature lines can be added to the chart.
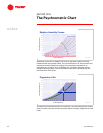
'HWHUPLQLQJ:HW%XOE/LQHV
$
$
%
,
%
,
&
,
&
,
'
,
'
,
%
%
&
&
'
'
$
,
$
,
'U\%XOE7HPSHUDWXUH)
'U\%XOE7HPSHUDWXUH)
+XPLGLW\5DWLRJUDLQV
+XPLGLW\5DWLRJUDLQV
OE
OE
RIGU\DLU
RIGU\DLU
Figure 22