


14
Application
Considerations
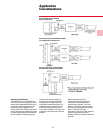
Performance Data Determination
The fan performance section of this
catalog contains a fan performance
table and fan curve for each fan size.
The performance data contained in this
catalog was calculated from tests
conducted in accordance with AMCA
Standard 210 Laboratory Methods of
Testing Fans for Rating.
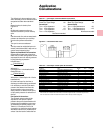
The AMCA test procedure uses an
open inlet and 10 wheel diameters of
straight discharge ductwork to assure
maximum static regain. The fan is
direct driven by a dynamometer.
The fan performance tables in this
catalog are based upon standard air:
0.075 lbs/ft
3
(70 F, barometric pressure
29.92-inches Hg).
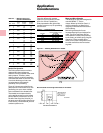
Fan Performance Curves
A fan performance curve is a graphical
presentation of the performance of a
fan. Usually it covers the entire range
from free delivery (wide open cfm, no
obstruction to flow) to no delivery
(blocked tight, an airtight system with
no air flowing).
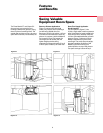
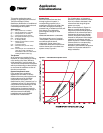
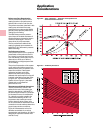
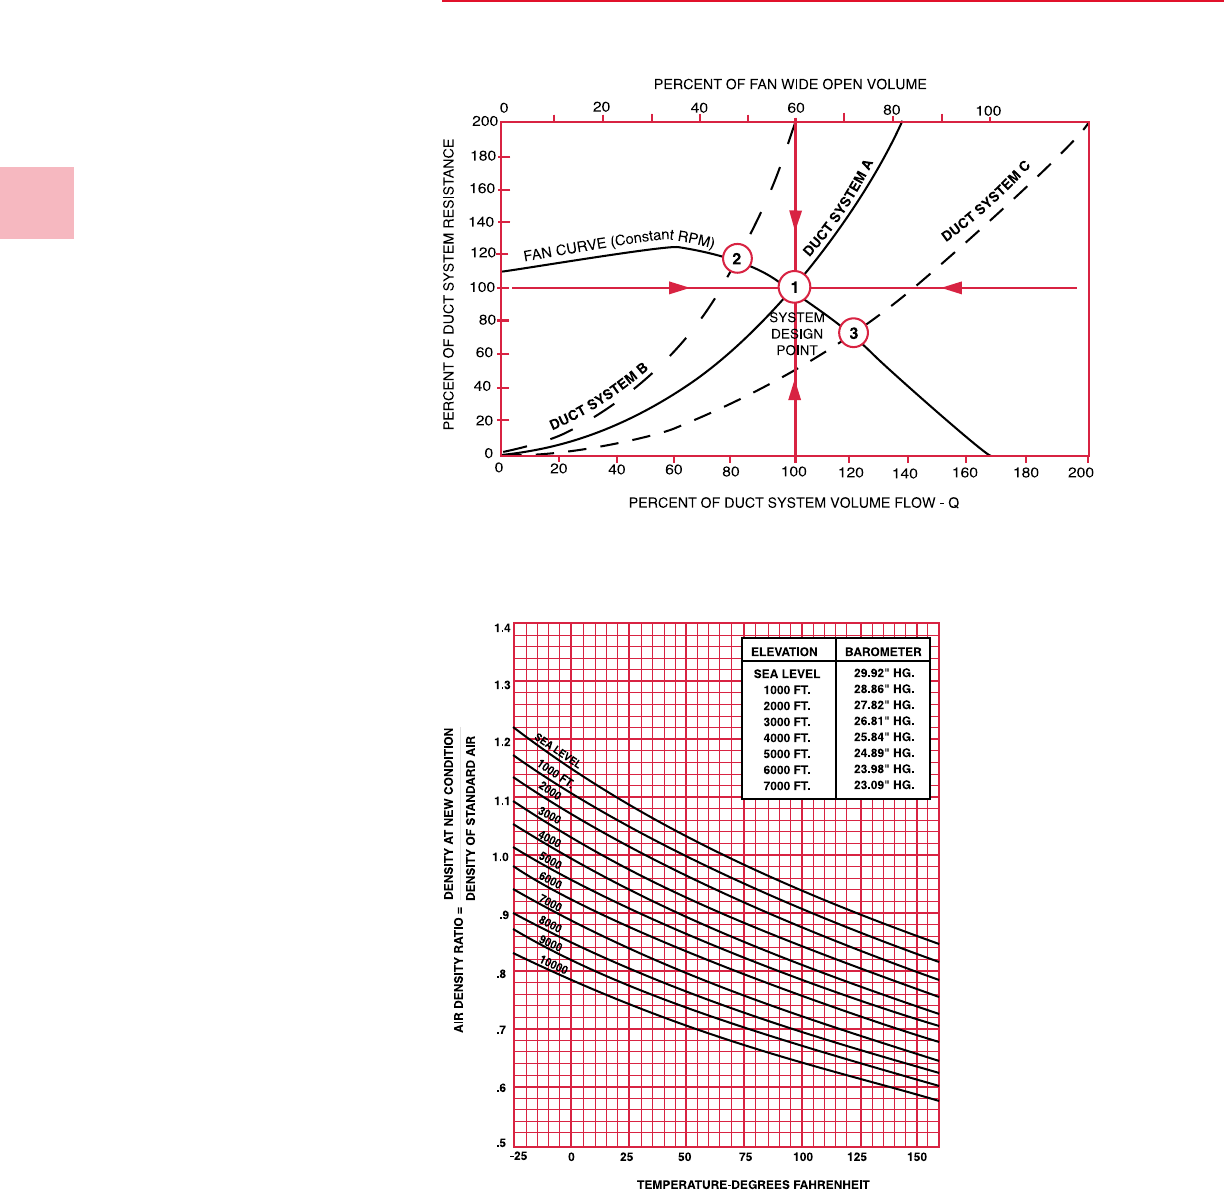
The point of intersection of the system
curve and the fan performance curve
determines the point of operation and
actual flow volume. If the system
resistance has been accurately
determined and the fan properly
selected, their performance curves will
intersect at the design flow rate. Refer
to Figure A-2. The normalized Duct
System A from Figure A-1 has been
plotted with a normalized fan
performance curve.
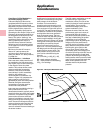
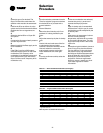
Temperature and Altitude Corrections
The fan performance values in the
tables and curves of this catalog are
based on standard air (.075 lbs/ft
3
). If
the airflow requirement for a particular
job is stated in terms of nonstandard
air, a density correction needs to be
made before selecting the fan. It is
important to also note that most air
friction charts for ducts, filters, coils,
etc. are also based on standard air and
corrections must be made to determine
proper losses at other conditions.
Figure A-3 illustrates the ratio of air
densities to standard air at various
temperatures and elevations. A Q fan is
designed for operation between -20 F
and 150 F only.
Figure A-2 — Point of Operation — Interaction of the System Curve
and the Fan Performance Curve
Figure A-3 — Air Density Corrections