


6
7
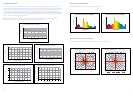
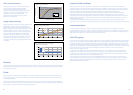
Lumen maintenance
Lumen maintenance graphs show light output performance through life for statistically representative batches of lamps
operated under controlled nominal conditions with a 7 hours per start switching cycle. A common characteristic for all metal
halide lamps is a reduction in light output and a slight increase in power consumption through life. Consequently there is an
economic life at which lamp efficacy falls to a level when lamps should be replaced to restore design illumination levels.
Where a quantity of lamps are installed within an area, consideration should given to a group lamp replacement programme
to maintain uniform illumination levels. Curves represent operating conditions for a 7 hours per start switching cycle, but less
frequent switching will improve lumen maintenance.
Note: The representative curves are shown for Vertical Base-Up lamp orientation unless otherwise specied. Lumen
maintenance performance is significantly improved in the Horizontal burning position.
Burning time (thousand hours)
% of Initial
Lumen Maintenance 70W G8.5 4200K
40
20
0
60
80
100
2 4 6 810 12 14 160
Burning time (thousand hours)
% of Initial
Lumen Maintenance 70W G8.5 3000K
40
20
0
60
80
100
2 4 6 810 12 14 160
Burning time (thousand hours)
% of Initial
Lumen Maintenance 35W G8.5 3000K
40
20
0
60
80
100
2 4 6 810 12 14 160
85
80
75
70
65
60
90
95
100
2 4 6 810 120
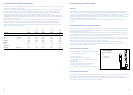
Lumen Maintenance 35W G8.5 4200K
Burning time (thousand hours)
% of Initial
85
80
75
70
65
60
90
95
100
2 4 6 8 10 120
Lumen Maintenance 20W G8.5 3000K
Burning time (thousand hours)
% of Initial
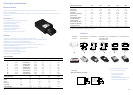
Special power distribution
Spectral Power Distribution curves are given in the following diagram
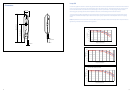
Distribution of luminous intensity
The following diagrams show polar light intensity curves for lamp base-up orientation
Spectral Power Distribution [3000K]
0
20
30
40
50
60
0
70
10
WWaavveelleennggtthh [[nnmm]]
[mW/nm x lm]
380 430 480 530 580 630 680 730
Imax=170.13 cd at 100º
Vertical plane polar intensity curve
I (cd)
195˚ 180˚210˚ 165˚ 150˚ 135˚
120˚
60˚
45˚ 30˚15˚305˚330˚
225˚
140˚
255˚
270˚
285˚
300˚
105˚
90˚
75˚
315˚
120
80
40
80
120
0
160
160
40
C180 C270 C0 C90
Vertical plane polar intensity curve
I (cd)
Imax=170.13 cd at 100º
165˚150˚ 165˚ 150˚ 135˚
120˚
60˚
45˚ 30˚15˚15˚30˚
135˚
120˚
105˚
90˚
75˚
60˚
105˚
90˚
75˚
45˚
90
60
30
60
90
0
120
120
30
C180 C270 C0 C90
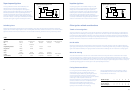
Spectral Power Distribution [4200K]
0
20
30
40
50
60
0
70
10
WWaavveelleennggtthh [[nnmm]]
[mW/nm x lm]
380 430 480 530 580 630 680 730