


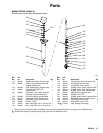

307619 21
Technical Data
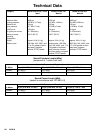
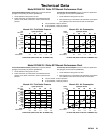
Model 223596 23:1 Ratio CST Monark Performance Chart
0
750
1500
2250
3000
0.0 0.1 0.2 0.3 0.4 0.5
Monark 23:1 Fluid Outlet Pressure
15 30 45 7560
psi
MPa, bar
cycles per minute
gpm
liters/minute
0.4 0.8 1.2 1.5 1.9
FLUID FLOW (TEST FLUID: NO. 10 WEIGHT OIL)
FLUID PRESSURE
21, 210
15.8, 158
5.1, 51
10.4,104
A
B
C
To find Fluid Outlet Pressure (psi/MPa/bar) at a specific fluid flow
(lpm/gpm) and operating air pressure (psi/MPa/bar):
1. Locate desired flow along bottom of chart.
2. Follow vertical line up to intersection with selected fluid outlet
pressure curve (black). Follow left to scale to read fluid outlet
pressure.
To find Pump Air Consumption (m#/min or scfm) at a specific fluid
flow (lpm/gpm) and air pressure (psi/MPa/bar):
1. Locate desired flow along bottom of chart.
2. Read vertical line up to intersection with selected air consumption
curve (dashes). Follow left to scale to read air consumption.
A 120 psi (0.8 MPa, 8 bar) air pressure
B 70 psi (0.49 MPa, 4.9 bar) air pressure
C 40 psi (0.28 MPa, 2.8 bar) air pressure
0
4
8
12
16
0.0 0.1 0.2 0.3 0.4 0.5
Monark 23:1 Air Consumption
15 30 45 7560
scfm
m#/min
cycles per minute
gpm
liters/minute
0.4 0.8 1.2 1.5 1.9
FLUID FLOW (TEST FLUID: NO. 10 WEIGHT OIL)
AIR CONSUMPTION
A
B
C
0.45
0.34
0.22
.011
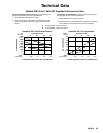
Model 237958 23:1 Ratio SST Monark Performance Chart
0
500
1000
1500
2000
2500
3000
3500
0.0 0.1 0.2 0.3 0.4 0.5
Monark 23:1 Fluid Outlet Pressure
15 30 45 7560
psi
MPa, bar
cycles per minute
gpm
liters/minute
0.4 0.8 1.2 1.5 1.9
FLUID FLOW (TEST FLUID: NO. 10 WEIGHT OIL)
FLUID PRESSURE
21, 210
17.5, 175
3.5, 35
7,70
A
B
C
To find Fluid Outlet Pressure (psi/MPa/bar) at a specific fluid flow
(lpm/gpm) and operating air pressure (psi/MPa/bar):
1. Locate desired flow along bottom of chart.
2. Follow vertical line up to intersection with selected fluid outlet
pressure curve (black). Follow left to scale to read fluid outlet
pressure.
To find Pump Air Consumption (m#/min or scfm) at a specific fluid
flow (lpm/gpm) and air pressure (psi/MPa/bar):
1. Locate desired flow along bottom of chart.
2. Read vertical line up to intersection with selected air consumption
curve (dashes). Follow left to scale to read air consumption.
A 150 psi (1.0 MPa, 10 bar) air pressure
B 70 psi (0.49 MPa, 4.9 bar) air pressure
C 40 psi (0.28 MPa, 2.8 bar) air pressure
0
4
8
12
16
0.0 0.1 0.2 0.3 0.4 0.5
Monark 23:1 Air Consumption
15 30 45 7560
scfm
m#/min
cycles per minute
gpm
liters/minute
0.4 0.8 1.2 1.5 1.9
FLUID FLOW (TEST FLUID: NO. 10 WEIGHT OIL)
AIR CONSUMPTION
A
B
C
0.45
0.34
0.22
.011
14, 140
10.5, 105
24.5, 245