2-11
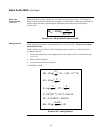
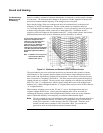
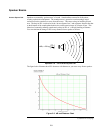
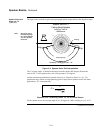
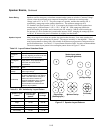
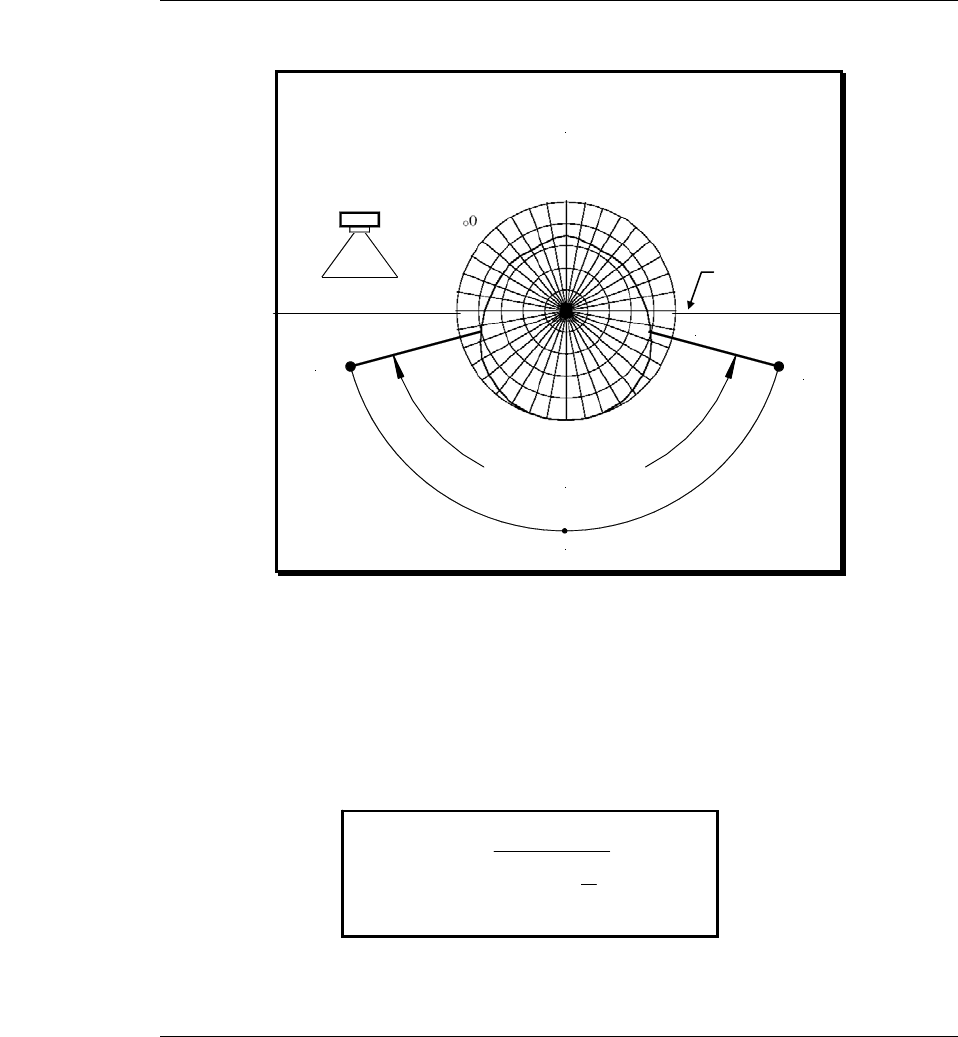
The figure below includes a typical polar plot graph and the interpretation of the dispersion angle.
87dB
87dB
Sensitivity = 93dB @10 Feet, 1 W
Simplex 4902-9721
Ceiling Mount Speaker
Polar Plot - 2kHz 0
º
6dB/division
7
5
º
off
ax
i
s
Dispersion Angle
Figure 2-4. Speaker Polar Plot Interpretation
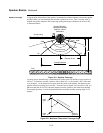
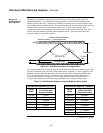
The “Coverage Angle” is defined as the angle where the speaker SPL drops 6 dB from the
on-axis SPL. For the speaker above, the coverage angle is 150 degrees.
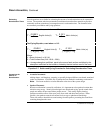
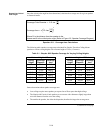
Another common representation of speaker directivity is “Directivity Factor” or “Q.” For
speakers having a conical coverage pattern (typical of single driver speakers used in fire alarm
applications), “Q” is determined by:
Equation 2-10. Directivity Factor “Q” for a Conical Source
For the speaker above, the coverage angle (θ) is 150 degrees at 2 kHz, resulting in a “Q” of 2.7.
Continued on next page
Speaker Basics, Continued
Speaker Dispersion
Angle and “Q”
(continued)
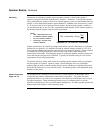
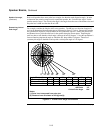
Note: See Figure 2-5 on
the following page
for a more detailed
view of a Speaker
Polar Plot.
Ceiling
Q =
⎟
⎠
⎞
⎜
⎝
⎛
−
2
θ
cos1
2


