


edwin 02
|
2003
13
2
4
6
8
10
12
14
5,0
4,0
3,0
2,0
1,0
30
25
20
15
10
5
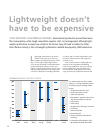
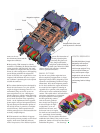
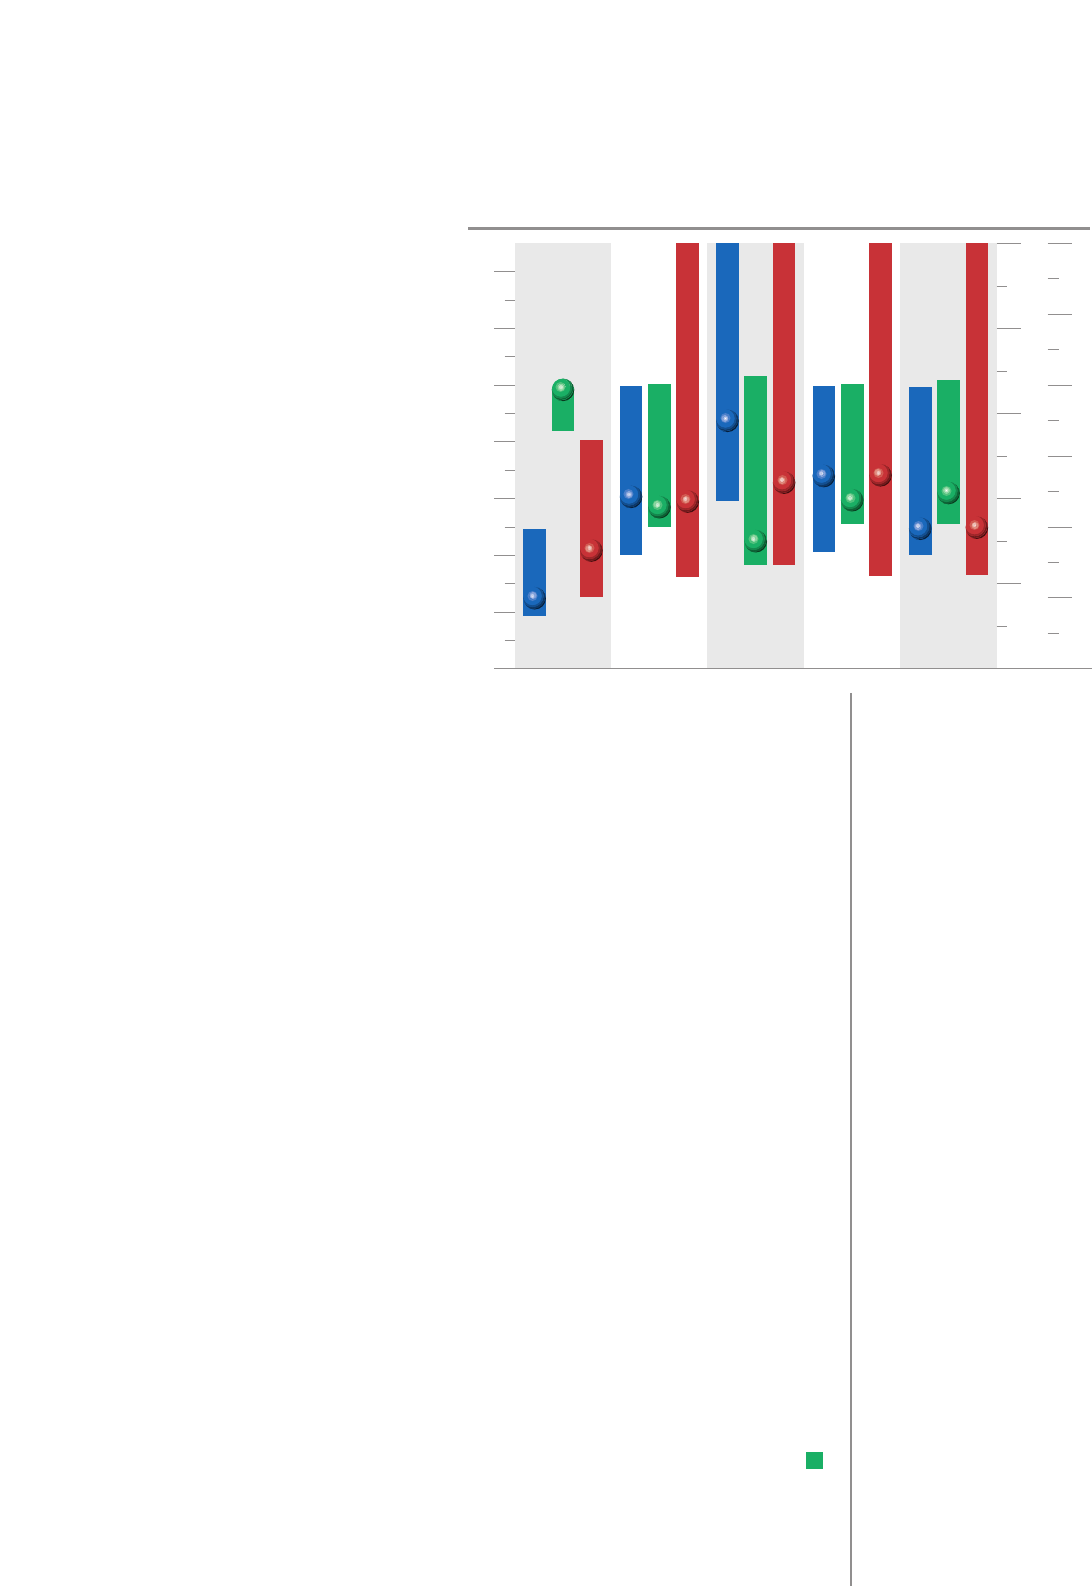
BLUE, GREEN, RED
The blue bars represent the
specific costs of the material.
The bottom end marks the
cost-optimized solution for the
material in question.The blue
ball represents the targeted
concept status.The designer
can thus ascertain the cost of a
particular design.
The green bars stand for
weight. Once again, the ends
of the bars should be regarded
as positive and negative
benchmarks.The green ball
represents the target weight.
The designer can thus ascer-
tain how lightweight a particu-
lar design is.
The absolute costs are shown
in red. Multiplying the above
values produces the range.The
designer can ascertain whether
the cost targets have been
met.
techniques. The reasons are as varied as the
spectrum of alternative materials available:
the often biased expertise of concept engi-
neers regarding the potential, maturity and
cost of alternative materials, semi-finished
products and techniques, the expensive proce-
dures before they are released as suitable for
use, and insufficient importance being attrib-
uted to the learning curve in cost models.
Often dimensional concepts designed for use
with steel are used for lightweight materials;
when transposed at a ratio of 1:1, they gener-
ally result in greatly inadequate weight reduc-
tions. In practice, cost-optimized lightweight
construction fails not least because of a ten-
dency to ignore the designers’ old rule of
thumb that design costs should already be
fixed during the concept phase.
STARTING EARLY
Enter CWO (Cost Weight Optimization) – a
method developed by IVM Automotive that
allows simple calculation of production costs
for lightweight concepts very early on and a
positive impact on the whole process. CWO
enables the marketability of new materials or
semi-finished products to be assessed, new
techniques to be compared, and aims for their
development to be defined. Entire car bodies,
not to mention individual modules or compo-
nents, may be cost-optimized for each size of
production run. By the end of the develop-
ment process you have a vehicle that strikes
the right balance between cost, weight and
other required properties in production, too.
At the heart of the CWO method lies the
simple cost equation
C = m • Cs
Where C is the cost of the component in
euros, m its mass in kilos, and Cs the specific
cost in /kg of the ready-to-fit component:
this includes material and production costs,
tooling cost depreciation and extra charges.
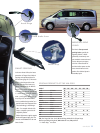
Specific costs are generally determined by
only a handful of cost factors. In a CWO pro-
ject, the designer receives a table of possible
materials matching the project concerned and
the scale of production; the contents of the
table vary considerably depending on the lat-
ter (diagram left).
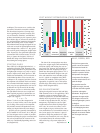
The aim of the concept phase must be to
achieve the weight targets while maintaining
sufficient rigidity and meeting the cost tar-
gets. In the past, however, the calculation of
production costs has frequently been post-
poned into subsequent project phases. If it is
assumed that automobile designers can opti-
mize and control the mass and other proper-
ties of a vehicle or component using finite
element (FE) methods, CWO represents an
opportunity to optimize costs at the earliest
possible stage while taking account of other
target values (diagram above).
BIG ENLIGHTENMENT
Having developed it between 1996 and 2001,
IVM Automotive has so far applied the CWO
method to various customer projects. The
results are persuasive: in each individual case,
whether involving small or large components,
in small or large production runs, the early
transparency in production costs for light-
weight construction effectively helped opti-
mize costs. In several cases where a maxi-
mum weight saving was achieved, the costs
even matched those of conventional construc-
tion. In one project, for instance, it proved
possible to design the production of a light-
metal car cross member in such a way that its
cost matched that of the reference model
while achieving a 50 percent reduction in
weight. Ralf Anderseck
COST WEIGHT OPTIMIZATION (CWO) DIAGRAM
Sheet steels-
hells
Aluminum,
conventional
Aluminum,
new process
Magnesium,
hot shaped
Aluminum,
IHPF
Specifiic costs (/kg)
Weight (kg)
Total cost ()