


XLA 3200 | Installation Manual |
Bosch Security Systems | January 2004
EN
|
15
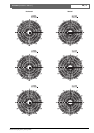
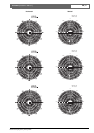
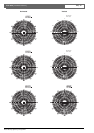
Background information:
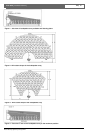
• The shapes are defined in an anechoic environment.
In these shapes at anechoic conditions, you have a
maximum of 6dB sound pressure variation and much
less perceived frequency response variation. In areas
with normal or high reverberations, less sound
pressure level variation take place and the size of
shapes will be bigger. The perceived frequency
response in this shape will then be almost constant.
• When you go further then the maximum position of
the listening area (beyond the maximum distance
from the loudspeaker array) only the sound pressure
level will decrease. There is almost no tone height
variation. The decrease in sound pressure level
depends strongly on the reverberation of the room.
• When you move too close to the loudspeaker arrays
(less than the minimum distance from the
loudspeaker array) a lack of high tones will very soon
occur.
• Depending of the amount of reverberation in the
room and the sound shadow (people or objects in
front of a listener who block the direct sound source),
the speech intelligibility at the furthest positions may
be low. In these situations, it is better use more
loudspeaker arrays to split the listening area.
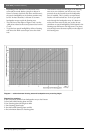
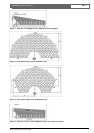
• The side lines of the shapes of figure 2 and 3 are the
–6dB points related to the sound pressure level on the
0
0
-axis.
• To get the best speech intelligibility, define a listening
area where the 4kHz octave shape covers the whole
area.
To determine exactly were the edges of the listening
area are in your situation, you have to carry out a
practical test at the location were the loudspeaker
array is installed. This is a job for an experienced
listener with well-trained ears. To do so, put pink
noise through the loudspeaker array. It is better to
reduce the lower tones for this test, as they do not
contribute to speech intelligibility. Walk around in the
listening area and listen to the high tones. The places
were the high tones decreases rapidly are the edges of
the listening area.
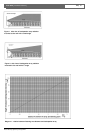
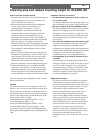
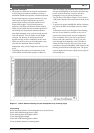
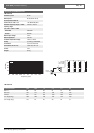
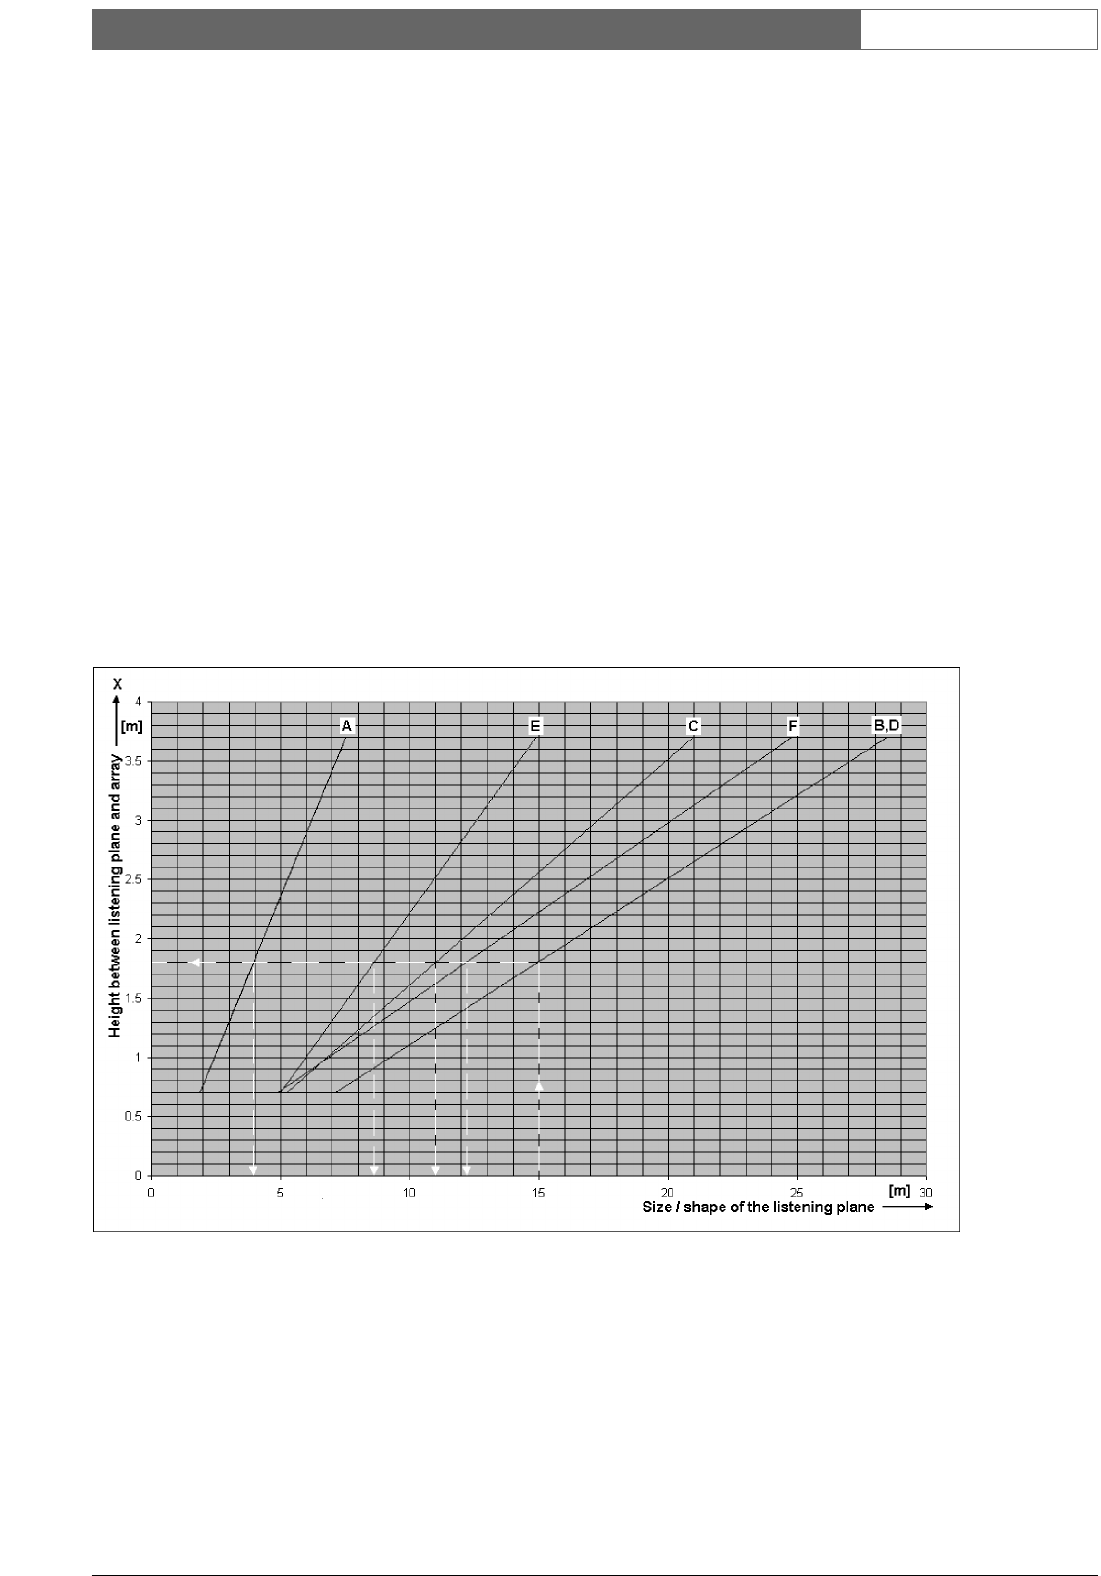
Diagram 1: relation between listening area and loudspeaker array mounting height
Line meaning
B-line: maximum distance from loudspeaker array to last listener.
D-line: half-width listening plane at 1kHz
F-line: listening plane side length at 4kHz
C-line: listening plane length
E-line: half-width listening plane at 4kHz
A-line: minimum distance to listening plane