138
Data Captured
The data displayed depends upon the selected cards and ports. General interface activity, such as the
number of octets, packets, and transmission errors, is provided for all port types.
About Tabular Formats
Network data may be viewed in a tabular or graph format.
The tabular format is ideal for numbers crunching when you want to know precise activity statistics.
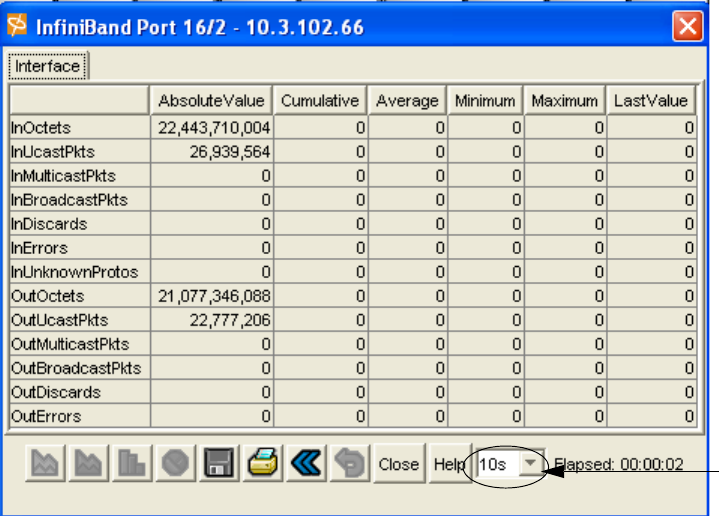
Figure 13-1: Single-port InfiniBand selected
Each row in the table is a parameter that is being logged, such as the number of multicast packets or
discarded packets.
The objects in the first column identify what is being logged. These are the names of the objects being
logged.
When only one port or card is selected, the remaining columns are counters that contain numeric data
that is derived from either actual values or computed from actual values.
About Graph Formats
Network data may be viewed in a tabular or graph format.
The graph format provides a comparative view of the same data so you can evaluate differences at a
glance.
Types of Graphs
The following types of graphs are available to visually depict network data:
•Pie
•Line
Rate of update


