


8
6.4 Calibration
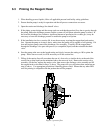
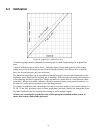
Figure 6, sample flow calibration curve
All metering pumps must be calibrated to accurately specify stroke length settings for required flow
rates.
A typical calibration chart is shown above. Although output is linear with respect to stroke length
setting, an increase in discharge pressure decreases output uniformly, describing a series of parallel
lines, one for each pressure (only two are shown).
The theoretical output flow rate at atmospheric discharge pressure is based on the displacement of the
diaphragm, stroke length and the stroking rate of the pump. With increasing discharge pressure there is
a corresponding decrease in output flow. Pumps are rated for a certain flow at a rated pressure (check
nameplate). Whenever possible, calibration should be performed under actual process conditions (i.e.,
the same or a similar process liquid at system operating pressure).
To construct a calibration chart, measure the flow rate several times at three or more stroke settings (i.e.,
25, 50, 75, and 100), plot these values on linear graph paper, and draw a best-fit line through the points.
For stable conditions, this line should predict settings to attain required outputs.
All users are encouraged to test the flow rate of their pump once installed in their system, to
ensure best accuracy and reliable operation.