Performance Charts
26 311211L
Performance Charts
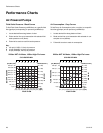
Air-Powered Pumps
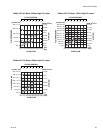
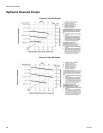
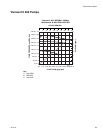
Fluid Outlet Pressure - Black Curves
To find Fluid Outlet Pressure (psi/MPa/bar) at a specific fluid
flow (gpm/lpm) and operating air pressure (psi/MPa/bar):
1. Locate desired flow along bottom of chart.
2. Follow vertical line up to intersection with selected fluid
outlet pressure curve (black).
3. Follow left to scale to read fluid outlet pressure.
Air Consumption - Gray Curves
To find Pump Air Consumption (scfm or m
3
/min.) at a specific
fluid flow (gpm/lpm) and air pressure (psi/MPa/bar):
1. Locate desired flow along bottom of chart.
2. Read vertical line up to intersection with selected air con-
sumption curve (dashes).
3. Follow left to scale to read air consumption.
Key:
A 100 psi (0.7 MPa, 7.0 bar) air pressure
B 70 psi (0.49 MPa, 4.9 bar) air pressure
C 40 psi (0.28 Mpa, 2.8 bar) air pressure
2200cc NXT Air Motor, 1000cc High-Flo Lower
FLUID PRESSURE
FLUID FLOW
AIR FLOW
450 (3.1, 31)
psi (MPa, bar)
400 (2.8, 28)
350 (2.4, 24)
300 (2.1, 21)
250 (1.7, 17)
200 (1.4, 14)
150 (1.0, 10)
100 (0.7, 7)
50 (0.3, 3)
0 (0, 0)
2.0
(7.0)
4.0
(15.0)
6.0
(22.5)
8.0
(30.0)
10.0
(37.9)
12.0
(45.4)
14.0
(53.0)
gpm
(lpm)
0.0
(0.0)
70 (1.96)
60 (1.68)
50 (1.40)
40 (1.12)
30 (0.84)
20 (0.56)
10 (0.28)
SCFM (m
3
/min.)
0 (0.0)
B
CYCLES PER MIN.
A
C
B
A
C
2200cc NXT Air Motor, 1500cc High-Flo Lower
FLUID PRESSURE
FLUID FLOW
AIR FLOW
psi (MPa, bar)
300 (2.1, 21)
250 (1.7, 17)
200 (1.4, 14)
150 (1.0, 10)
100 (0.7, 7)
50 (0.3, 3)
0 (0, 0)
2.0
(7.0)
4.0
(15.0)
6.0
(22.5)
8.0
(30.0)
10.0
(37.9)
12.0
(45.4)
14.0
(53.0)
gpm
(lpm)
0.0
(0.0)
50 (1.40)
45 (1.26)
40 (1.12)
30 (0.84)
20 (0.56)
10 (0.28)
SCFM (m
3
/min.)
0 (0.0)
B
CYCLES PER MIN.
A
C
B
A
C
35 (0.98)
25 (0.7)
15 (0.42)
5 (0.14)
0
7
14
20 26 33
39
45
05
10
15
20 24
28
32


