


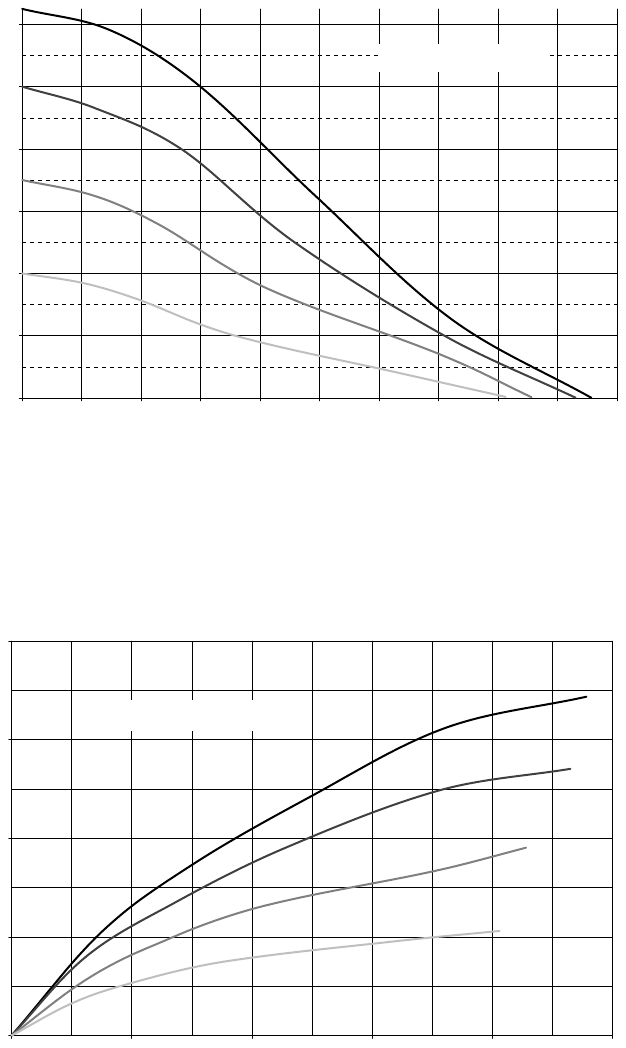
Performance Charts
312877P 21
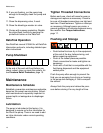
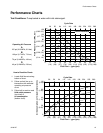
Performance Charts
Test Conditions: Pump tested in water with inlet submerged.
0
510
15 20 25
30 35 40
45 50
(19) (38)
(57) (76) (95)
(114) (133) (152)
(170) (189)
A
B
C
D
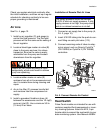
How to Read the Charts
1. Locate fluid flow rate along
bottom of chart.
2. Follow vertical line up to
intersection with selected
operating air pressure
curve.
3. Follow left to scale to read
fluid outlet pressure
(top chart) or
air consumption
(bottom chart).
0510
15
20 25 30 35 40 45
50
(19) (38)
(57)
(76) (95)
(114) (133) (152)
(170)
(189)
Fluid Flow — gpm (lpm)
20
40
60
80
(0.56)
(1.12)
(1.68)
(2.24)
A
B
C
D
0
0
20
40
60
80
100
120
(0.14, 1.4)
(0.28, 2.8)
(0.41, 4.1)
(0.55, 5.5)
(0.7, 7.0)
(0.83. 8.3)
Fluid Flow — gpm (lpm)
Air Consumption - scfm (cubic meters/min.)
Operating Air Pressure
A
125 psi (0.83 MPa, 8.3 bar)
B
100 psi (0.7 MPa, 7.0 bar)
C
70 psi (0.48 MPa, 4.8 bar)
D
40 psi (0.28 MPa, 2.8 bar)
Fluid Pressure - psi (MPa, bar)
Fluid Pressure
Air Consumption
28 56 84 112 140 168 196 224 252 280
28 56 84 112 140 168 196 224 252 280
Cycle Rate
Cycle Rate