


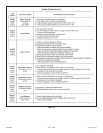

506469-01 Issue 1008 Page 15 of 24
6. Compare the approach value with those shown in Table
7. If the values do not agree with those provided in Table 7,
add refrigerant to lower the approach temperature or recover
refrigerant from the system to increase the approach
temperature.
Check Charge Using Normal Operating Pressures
Use Table 8 to perform maintenance checks. Table 8 is not
a procedure for charging the system. Minor variations in
these pressures may be due to differences in installations.
Significant deviations could mean that the system is not
properly charged or that a problem exists with some
component in the system.
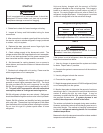
=
_
Outdoor Ambient Temperature °F
Liquid Line Temperature °F
Approach Temperature °F
°
°
°
=
_
Liquid Line Temperature °F
Saturation Temperature °F
Subcooling Value °F
°
°
°
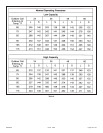
Table 7
Subcooling Values
Table 8
Approach Values for TXV Systems
Approach value is the liquid line temperature minus
the outdoor ambient temperature (± 1°F).
Note: For best results, use the same digital
thermometer to check both outdoor ambient and
liquid temperatures.
Table 6
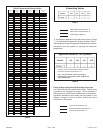
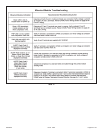
Temp.
(F
Pressure
Psig
Temp.
(F
Pressure
Psig
Temp.
(F
Pressure
Psig
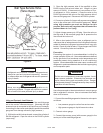
32 100.8 74 214.0 116 396.0
33 102.9 75 217.4 117 401.3
34 105.0 76 220.9 118 406.7
35 107.1 77 224.4 119 412.2
36 109.2 78 228.0 120 417.7
37 111.4 79 231.6 121 423.2
38 113.6 80 235.3 122 428.8
39 115.8 81 239.0 123 434.5
40 118.0 82 242.7 124 440.2
41 120.3 83 246.5 125 445.9
42 122.6 84 250.3 126 451.8
43 125.0 85 254.1 127 457.6
44 127.3 86 258.0 128 463.5
45 129.7 87 262.0 129 469.5
46 132.2 88 266.0 130 475.6
47 134.6 89 270.0 131 481.6
48 137.1 90 274.1 132 487.8
49 139.6 91 278.2 133 494.0
50 142.2 92 282.3 134 500.2
51 144.8 93 286.5 135 506.5
52 147.4 94 290.3 136 512.9
53 150.1 95 295.1 137 519.3
54 152.8 96 299.4 138 525.8
55 155.5 97 303.8 139 532.4
56 158.2 98 308.2 140 539.0
57 161.0 99 312.7 141 545.6
58 163.9 100 317.2 142 552.3
59 166.7 101 321.8 143 559.1
60 169.6 102 326.4 144 565.9
61 172.6 103 331.0 145 572.8
62 175.5 104 335.7 146 579.8
63 178.5 105 340.5 147 586.8
64 181.6 106 345.3 148 593.8
65 184.3 107 350.1 149 601.0
66 187.7 108 355.0 150 608.1
67 190.9 109 360.0 151 615.4
68 194.1 110 365.0 152 622.7
69 197.3 111 370.0 153 630.1
70 200.6 112 375.1 154 637.5
71 203.9 113 380.2 155 645.0
72 207.2 114 385.4
73 210.6 115 390.7
72 207.2 114 385.4
73 210.6 115 390.7
R410A Temperature/Pressure Chart